The 30-year fixed hit 6.95% on September 17, up 19 bps in a week. The Fed's quarter-point hike the day before did not cause that. The 10-year Treasury did, crossing 5% before the Fed spoke. On a $297,600 loan that is $1,970 a month.
| In the "6.95%" headline | What's confirmed | What's interpretation |
|---|---|---|
| +19 bps in one week | Freddie Mac PMMS, Sept 17 vs Sept 10 | — |
| Fed funds +25 bps, Sept 16 | Target range now 3.75%–4.00%, 12–0 vote | That it moved the 30-year |
| 10-year Treasury | 5.00% Sept 15, 5.01% Sept 16, 4.94% Sept 17 | Which buyers it reaches first |
| +69 bps year over year | 6.26% in the comparable 2025 week | That "the Fed" explains it |
Two numbers landed within 24 hours of each other, and nearly every writeup wired them together in the obvious direction. The wiring is backwards. Below is the transmission chain that actually sets a 30-year rate, the survey window that made the timing look causal, and what the gap between 6.95% and a builder's bought-down 5.50% is worth in dollars.
Why the Fed's 25 basis points is the wrong culprit
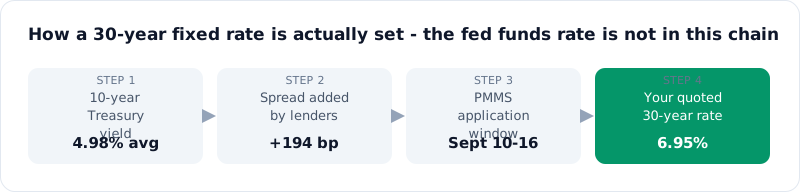
The federal funds rate is an overnight rate. It sets the price of money that banks lend each other until tomorrow morning. A 30-year fixed mortgage is priced off the 10-year Treasury yield plus a spread that covers servicing, prepayment risk, and the return mortgage-backed securities investors demand. The fed funds rate touches the 30-year only indirectly, by shifting expectations about the path of short rates over the next decade — and the bond market had already formed that expectation weeks earlier.
Here is the arithmetic, using only two primary sources. On September 16 the 10-year Treasury closed at 5.01% (U.S. Treasury daily par yield curve). Freddie Mac's 30-year average printed at 6.95% the next day. That is a spread of 194 basis points. In the comparable week of September 2025, the 10-year sat at 4.06% and the 30-year fixed averaged 6.26% — a spread of 220 basis points.
So over twelve months:
- 10-year Treasury: +95 bps
- Mortgage spread over the 10-year: −26 bps (it compressed)
- Net change in the 30-year fixed: +69 bps
Ninety-five minus twenty-six equals sixty-nine. The entire year-over-year increase in what you pay is accounted for by the long end of the Treasury curve, with lenders actually taking a thinner cut than they did a year ago. The fed funds rate does not appear in that equation, because it is not in the pricing chain.
The survey window is doing the work the Fed gets credit for
The timing looks causal because of how Freddie Mac builds the number. The Primary Mortgage Market Survey is not a phone poll taken on release morning. It is drawn from loan applications submitted to Freddie Mac through Loan Product Advisor by thousands of lenders — credit unions, commercial banks, and mortgage companies — and the application week runs from 12:00 a.m. ET Thursday through 11:59 p.m. ET the following Wednesday, published Thursday at noon (Freddie Mac PMMS).
The 6.95% print therefore covers applications from Thursday, September 10 through Wednesday, September 16. The FOMC announced at 2:00 p.m. ET on that final Wednesday. Roughly the last ten hours of a seven-day window sat on the far side of the announcement, and rate sheets for most of that Wednesday were set in the morning.
Now compare the two windows against the bond market, using Treasury's daily closes:
| PMMS window | 10-year closes | Window average | PMMS 30-year |
|---|---|---|---|
| Sept 3 – Sept 9 | 4.77, 4.78, 4.80, 4.83 | 4.795% | 6.76% |
| Sept 10 – Sept 16 | 4.95, 4.96, 4.97, 5.00, 5.01 | 4.978% | 6.95% |
| Change | — | +18.3 bps | +19 bps |
An 18-basis-point move in the 10-year across the two application windows; a 19-basis-point move in the mortgage average. The two series tracked each other to within a single basis point, and the 10-year did the moving on September 10 and 11 — five and six days before the Fed met.
What happened after the decision points the same way. The 10-year closed at 5.01% on decision day and 4.94% the next, seven basis points lower. If a hike pushed mortgage rates up, the long end of the curve declined to say so.
The reason the 10-year rose in the first place sits in the August CPI report, released September 11 — right inside the window. Headline inflation ran 3.4% year over year while core inflation came in at 2.4%, and the gasoline index was up 27.4% from a year earlier, with its 3.9% monthly jump accounting for more than a third of the month's total increase (BLS, Consumer Price Index). An energy-driven headline with a contained core is exactly the mix that lifts inflation expectations and term premium without changing the near-term policy outlook. That is a long-rate story, not a short-rate story.
The Fed's own projections reinforce it. The September Summary of Economic Projections put the median federal funds rate at 4.1% at the end of 2026 and 4.1% at the end of 2027, with a longer-run median of 3.2% — twelve of the participants clustered at 4.125% for year-end 2026, four above (Federal Reserve, SEP). A path that flat, that far out, is a mild input to a 30-year mortgage. The committee also raised its 2026 PCE inflation median to 3.7% and core PCE to 3.4%, which is the number the bond market read.
If you have been tracking this cycle, the setup was visible in July, when a hike first became a live possibility — see The Fed Might Actually Hike on July 29 — and the inflation reacceleration behind it was already reshaping the picture in The Fed Meets June 16–17 With Inflation Back at 4.2%.
Who actually pays for this rate — and who doesn't
The 25 basis points was not irrelevant. It was irrelevant to the 30-year fixed. Short-rate moves land hard elsewhere, and separating the groups keeps you from applying one headline to the wrong balance sheet.
| Who | What the week did | The mechanism |
|---|---|---|
| Direct — locking a 30-year fixed now | Quoted rate moved with the 10-year, roughly +19 bps in a week | Priced off the 10-year plus spread; the hike is a second-order input |
| Direct — HELOC and credit card balances | Costs rise with the hike, typically within one or two billing cycles | Indexed to the prime rate, which moves with fed funds |
| Read-through — adjustable-rate holders | Depends on the index and reset date, not on this week's print | ARMs reset on SOFR or Treasury indexes at contractual intervals |
| Read-through — refinance candidates | The 10-year, not the Fed's next meeting, decides whether a window opens | A refi only works if the long end falls |
| Who pays for buydowns — builders | Lennar's Q3 net earnings fell to $284M from $591M a year earlier | Incentives come out of gross margin, which fell to 15.8% from 17.5% |
| Who pays for buydowns — buyers at list price | Lower monthly payment, unchanged principal | The subsidy shows up in the rate, not the loan amount |
Lennar's figures are Lennar's (Lennar Q3 2026 results). The company reported $1.19 in diluted EPS against $2.29 a year earlier, deliveries down 3% to 20,840 homes, new orders down 9%, an average sales price of $372,000 against $383,000, and full-year delivery guidance cut to 80,000–81,000 homes from 82,000–83,000. Those numbers describe one builder's quarter. They are not a read on the industry, and none of them should be transferred to another builder's incentive structure without that builder's own disclosure.
What 6.95% costs you on a $297,600 loan
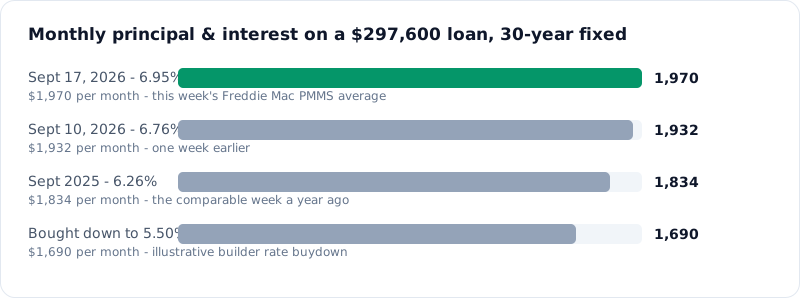
Take Lennar's $372,000 average sales price, put 20% down, and finance $297,600 over 30 years. Every figure below comes from running that balance through the repayment model behind our calculator, which amortizes an equal-payment loan month by month.
| Scenario | Rate | Monthly P&I | Total 30-year interest |
|---|---|---|---|
| PMMS, Sept 17, 2026 | 6.95% | $1,970 | $411,585 |
| PMMS, Sept 10, 2026 | 6.76% | $1,932 | $397,994 |
| PMMS, comparable 2025 week | 6.26% | $1,834 | $362,752 |
| Bought down (illustrative) | 5.75% | $1,737 | $327,617 |
| Bought down (illustrative) | 5.50% | $1,690 | $310,706 |
| Bought down (illustrative) | 5.25% | $1,643 | $294,009 |
Three comparisons worth holding onto:
- One week: 6.76% to 6.95% is $38 a month, about $453 a year.
- One year: 6.26% to 6.95% is $136 a month on this balance, and $48,833 more interest over the full term. On a $400,000 loan the same move is $182 a month, roughly $2,188 a year. On $500,000 it is $228 a month.
- Rate versus buydown: 6.95% against a bought-down 5.50% is $280 a month and $100,879 in 30-year interest.
That last line is the one that reframes the headline. The distance between this week's print and a builder-subsidized rate is more than five times the distance between this week's print and last year's. Whatever moved in the bond market is smaller than what moves at a negotiating table.
Run your own balance in the Loan Repayment calculator → — enter your loan amount, rate, and term to see the monthly payment and total interest for your actual number rather than a $297,600 illustration.
Is a 12% incentive a discount or a rate buydown?
Lennar disclosed sales incentives of approximately 12.0% of base price in the quarter. On a $372,000 average sales price that is about $44,640 of value handed to the buyer. The form it takes changes the outcome, and this is where a mortgage headline stops being about mortgages and starts being about how a subsidy is structured.
Run both structures through the same amortization:
| Structure | Loan amount | Rate | Monthly P&I | Equity built in 5 years |
|---|---|---|---|---|
| 12% off the price | $261,888 | 6.95% | $1,734 | $15,501 |
| Full price, rate bought down | $297,600 | 5.50% | $1,690 | $22,437 |
The bought-down loan is $44 a month cheaper and builds $6,936 more equity over five years, because more of each payment goes to principal at a lower rate. The price-cut buyer owes $35,712 less principal from day one and keeps that advantage if home values fall or they sell early.
There is a break-even worth knowing before any negotiation. Using the same model, a 12% incentive delivered as a rate buydown has to get the loan to roughly 5.73% just to match the monthly payment of taking 12% off the price outright — and even at that rate, the buyer still owes $35,712 more. To match the price cut on total 30-year interest, the buydown has to reach about 6.25%, which it clears easily. The two structures answer different questions: a buydown optimizes the monthly payment, a price cut optimizes the balance sheet.
One tax detail that gets missed at closing. When a seller pays points on the buyer's behalf, the IRS treats the buyer as having paid them, and the buyer may deduct them under the same rules that apply to points they paid directly — nine conditions, including that the loan is secured by a main home and the points are shown on the settlement statement. The buyer must also reduce the home's basis by the amount of seller-paid points, even when they are deductible in the year paid (IRS Publication 936). A basis reduction is a deferred cost, not a free one, and it surfaces when the home is sold. This is information, not tax advice; a CPA should look at your closing statement.
Common mistakes when a builder incentive is on the table
- Comparing a bought-down monthly payment against a market-rate monthly payment without also comparing the two loan balances.
- Assuming an incentive percentage quoted at the company level applies to a specific community or floor plan. Incentives vary by inventory position.
- Treating a temporary buydown (a 2-1 that steps up) as though it were permanent. Ask which one is on the table, in writing.
- Forgetting that the deductibility of seller-paid points reduces basis, which raises the taxable gain later.
- Reading a builder's quarterly margin as a forecast of what it will offer next quarter.
What's confirmed and what still isn't
| Item | Confirmed | Still to check |
|---|---|---|
| 30-year fixed at 6.95%, Sept 17 | Freddie Mac PMMS, released Sept 17 at noon ET | Whether the next print gives back the move |
| PMMS window is Thu–Wed | Freddie Mac methodology, application-based via Loan Product Advisor | — |
| 10-year at 5.01% on Sept 16, 4.94% on Sept 17 | Treasury daily par yield curve | Whether 5% holds through October |
| Fed funds at 3.75%–4.00%, 12–0 | FOMC statement, Sept 16 | Vote rationale in the minutes |
| Median dot: 4.1% end-2026 | September SEP | Whether one more hike is delivered |
| Lennar incentives ~12.0% of base price | Lennar Q3 press release, Sept 16 | Split between price cuts and rate buydowns |
| Specific buydown rates offered | Not confirmed — the 5.25%–5.75% figures above are illustrations run through our model, not a disclosed Lennar program | Builder rate sheets, community by community |
| Mortgage spread at 194 bps | Computed: PMMS average minus same-week 10-year close | Whether spread compression continues |
What to watch next
- Thursday, September 24, noon ET — the next Freddie Mac PMMS print. Its application window runs Sept 17–23, the first window entirely after the Fed's decision. If 6.95% was a pre-decision artifact, this is where it shows.
- The 10-year Treasury close, daily — published by the U.S. Treasury each afternoon. It held 5.01% on Sept 18. Whether it stays above 5% matters more to a mortgage quote than anything the FOMC says in October.
- Around October 7 — minutes of the September 15–16 FOMC meeting, released three weeks after the decision. Look for how much of the committee's inflation concern is energy pass-through versus broad.
- October 27–28 — the next FOMC meeting. No Summary of Economic Projections at this one; the December 8–9 meeting has the next dot plot.
- Next builder earnings — the homebuilders reporting into late fall will show whether a 12%-of-price incentive level is one company's position or a sector-wide one. Compare gross margin and incentive disclosures, not headline EPS.
The next move depends on three things, not on 6.95%
The headline rate is a lagging summary of an application window that closed before the news everyone credits it to. What comes next depends on the 10-year Treasury holding or losing 5%, on whether the mortgage spread keeps compressing from 194 basis points or widens back toward last year's 220, and on whether builder incentives stay near 12% of base price as delivery guidance falls. If all three move the same direction, the printed rate moves a lot. If they offset, 6.95% can sit still while the deal available to an individual buyer changes materially in either direction.
Nothing here is a recommendation to lock, float, refinance, or buy. It is the arithmetic of where a rate comes from, so a quote can be read for what it is.
Method and sources
Period and basis. Rate figures cover the Freddie Mac PMMS releases of September 3, 10, and 17, 2026, plus the comparable week of September 2025 as reported in the year-ago column. Treasury yields are daily par yield curve closes for September 2026 and September 2025. All payment figures are principal and interest on a 30-year fixed, equal-payment amortization, computed by running each scenario through the repayment engine behind our loan calculator (src/lib/calc/loan.ts).
Exclusions. Payment figures exclude discount points, private mortgage insurance, property taxes, homeowners insurance, and HOA dues. A real monthly housing cost will be materially higher. The "equity built in 5 years" column is principal reduction only and assumes no change in home value. The 12% incentive is modeled as either a straight price reduction or a permanent rate buydown; temporary step-up buydowns amortize differently.
What was verified where.
- Freddie Mac — Primary Mortgage Market Survey — confirmed the 6.95% / 6.26% 30-year and 15-year averages for Sept 17, the 6.76% / 6.09% prior week, the 6.26% / 5.41% year-ago figures, and the methodology: application data via Loan Product Advisor over a Thursday-to-Wednesday window, published Thursday at noon ET.
- U.S. Department of the Treasury — Daily Treasury Par Yield Curve Rates — pulled every 10-year close for September 2026 and September 2025 used in the window averages and the spread calculation.
- Federal Reserve — FOMC statement, September 16, 2026 — confirmed the quarter-point increase to a 3.75%–4.00% target range and the unanimous 12–0 vote.
- Federal Reserve — Summary of Economic Projections, September 2026 — confirmed the 4.1% median federal funds projection for both 2026 and 2027, the 3.2% longer-run median, the dot distribution, and the 3.7% PCE / 3.4% core PCE medians for 2026.
- Federal Reserve — FOMC calendar — confirmed the October 27–28 and December 8–9 meeting dates and the three-week minutes release convention.
- Bureau of Labor Statistics — Consumer Price Index news release — confirmed August 2026 CPI at 3.4% headline and 2.4% core year over year, gasoline up 27.4% year over year, and gasoline's share of the monthly increase.
- Lennar — Q3 2026 results — confirmed net earnings of $284 million versus $591 million, $1.19 diluted EPS, the $372,000 average sales price, approximately 12.0% incentives, 15.8% gross margin, deliveries and orders, and the reduced full-year guidance.
- IRS — Publication 936, Home Mortgage Interest Deduction — confirmed that seller-paid points are treated as paid by the buyer, the nine conditions for deducting points in the year paid, and the requirement to reduce the home's basis by the amount of seller-paid points.
One figure from the original reporting was dropped rather than published: a widely repeated claim that the 10-year reached its highest level since 2007 could not be confirmed against a primary source, so this piece uses only the Treasury's own daily closes.
This is for information only, not tax, mortgage, or investment advice. Mortgage pricing varies by credit profile, loan-to-value, property type, and lender. Confirm your own numbers with your lender and a tax professional before acting.
Want to see what a lower rate would be worth if the savings were invested instead of spent? Run the monthly difference through the compound interest calculator and compare it against the payment gap in the table above.